Registration of multi-site camera systems
25 JUNE 2015 CEDAR workshop presentation on using Astrometry.net algorithm to register image with stars.
25 JUNE 2015 CEDAR workshop presentation on using Astrometry.net algorithm to register image with stars.
Jeff Cogswell’s article Learning Enough Python to Land a Job. calls out that Python is for more than web development, Django, Twisted, Flask, &c. As a data science practitioner, mangling tens of gigabytes if not tens of terabytes daily from sensors deployed around the globe, converting code to Python after several years of hard-core Matlab use was motivated by Python’s highly-performant data science stack incorporating Pandas, SciPy, Numpy, h5py and other specialty Python user modules.
dict(), list(), and numpy.array() along with the standard basic functions that one would use in Matlab or R. such as sqrt(), for, if, &c. Learn about Numpy and Pandas before dealing with generators, sets, list comprehensions, itertools, etc.xarray is the module to use. Pandas is awesome for loading and working with large heterogenous datasets. Think of Pandas as SQL for doing computations.We hope this commentary on Python for data scientists and analysts considering the transition to Python from languages such as R, Matlab, Fortran, etc. has helped you.
To overlay a contour on top of a Matlab “image()” or “pcolor()”, first rasterize the image and then overlay a contour to make it work in a 3-D Matlab figure. This is a bit complex to describe, so we created an example of contour over image in a 3-D Matlab figure: contourImage2.m. This script follows these steps:
Doing a contour overlay on a 2-D image or pcolor is much simpler especially in Python.
Matlab does not require special manipulations via freezeColors of the figure colormap in order to have a unique colormap for each axes (subplot) on a figure.
examples
Brilliant Hackaday SDR radar article by Juha Vierinen
Uses $8 USB RTL-SDR sticks and cheap antennas to detect reflections from airplanes, the ionosphere, and more!
If the man command on Linux isn’t working, check that the manual database is installed:
apt install man-dbmatplotlib.ticker.ScalarFormatter configures the colorbar and axes labels to not have too many decimal places.
If I made a standard line plot using the ScalarFormatter passed into a function, then subsequently passed the ScalarFormatter into another function that used colorbar, the line plot y-axis would be reset to match the limits of the later figure’s colorbar.
I didn’t think the ScalarFormatter would be able to feedback like that.
Enclose ScalarFormatter in its own function, then call that function from each of the plotting functions, thereby creating a new/unique ScalarFormatter for each figure.
The Madrigal distributed database allows access to much of the high level AMISR (incoherent scatter radar) data and DMSP data. For lower level data (e.g. I/Q digitized samples) you need to approach the PI of the relevant instrument for data.
Note: This problem was fixed in Matlab ≥ R2015a.
Matlab R2013 cannot handle uint64 seek offsets.
Octave ≥ 3.6 works with uint64 offsets.
offs = uint64(0); %or any number
fid = fopen(tempname);
fser = fseek(fid,offs,'bof');
fser == -1 for Matlab R2013a/R2013b (error)fser == 0 for Octave (correct)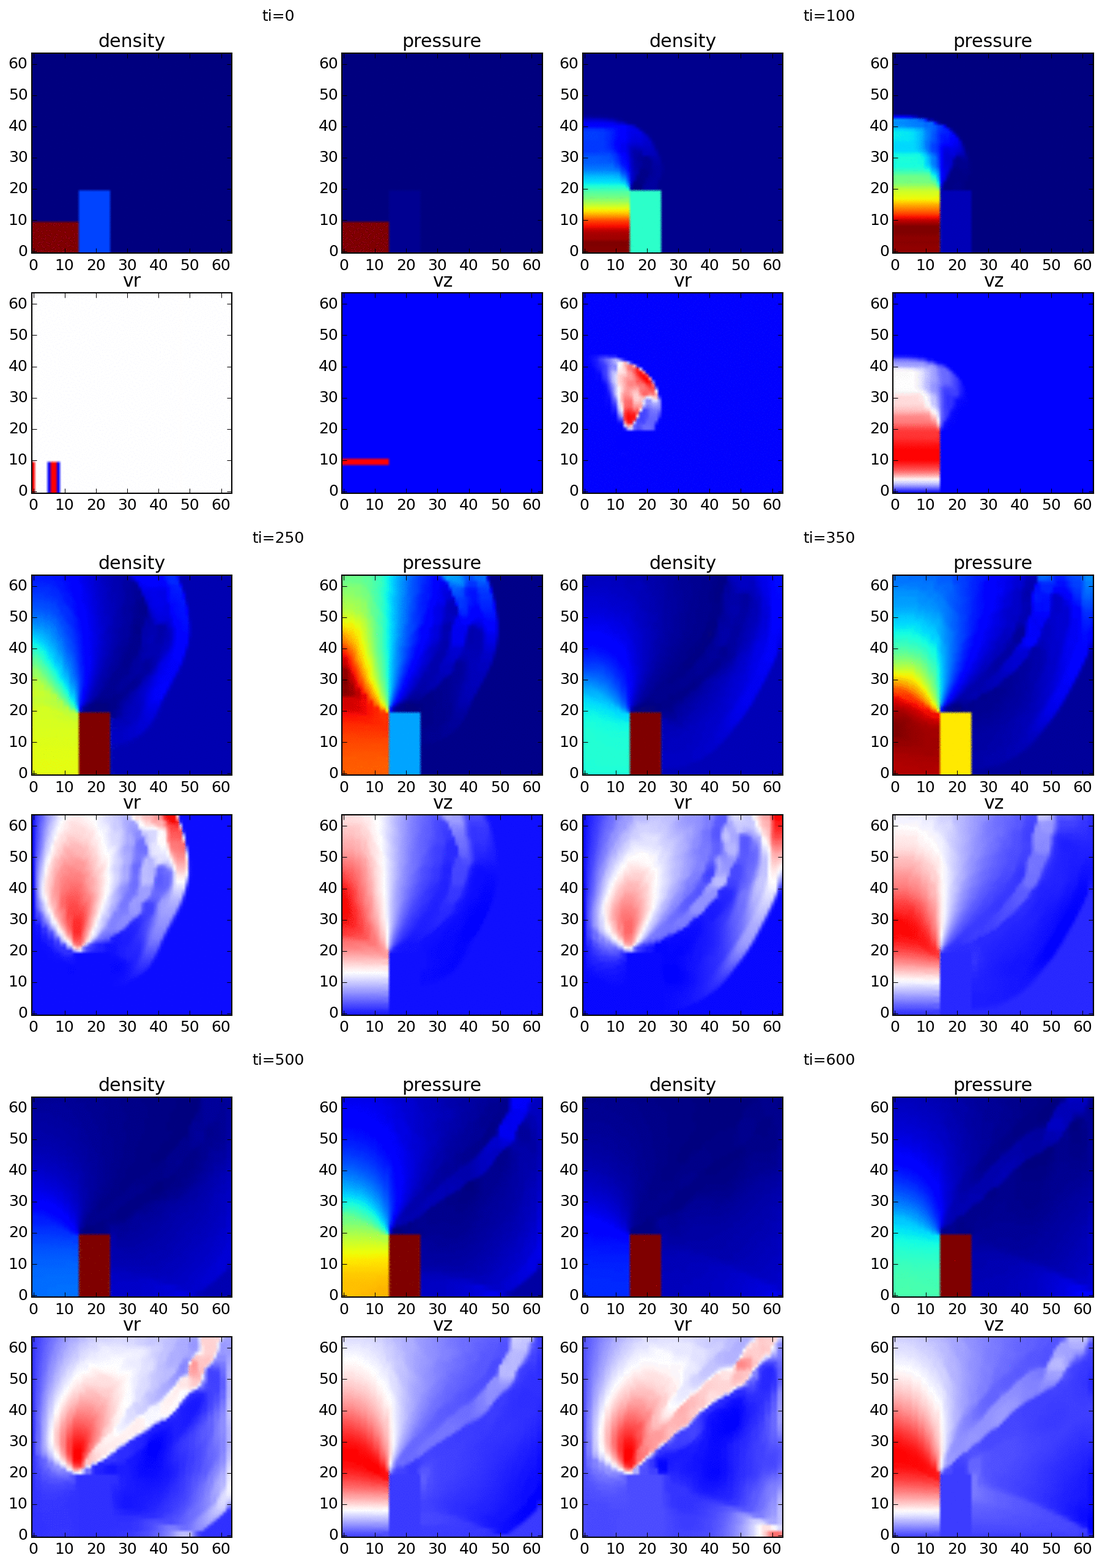
The venerable NRL Flux-Corrected Transport algorithm for Solving Generalized Continuity Equations has been cited in hundreds of publications.
Updated syntax of the original Fortran code slightly to fit with the FORTRAN 77 standard (not changing algorithm behavior, only syntactical correctness). Plotting code uses f2py to make the LCPFCT run from Python with 50x speedup overall since you don’t have to write output to disk and then read it back in via a custom parsing algorithm.