Coefficient of variation from uranyl slide
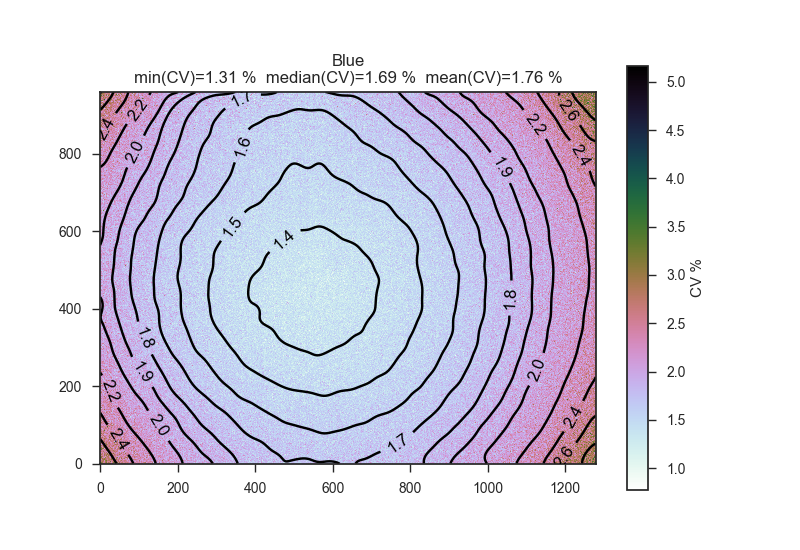
A first step in calibrating a whole-slide fluorescence cytometer is using a uranyl slide proving spatial uniformity to spatially normalize LED illumination and camera vignetting. We then measure the coefficient of variation (CV) for each pixel, expecting the CV to increase away from the center of slide as in the following Blue and UV excited fluorescence images.
In this data, the estimated CV is over 50 images and 1.3 ms exposure. The plots are created by PlotCV.py.
coefficient of variation with UV excitation on uranyl glass.
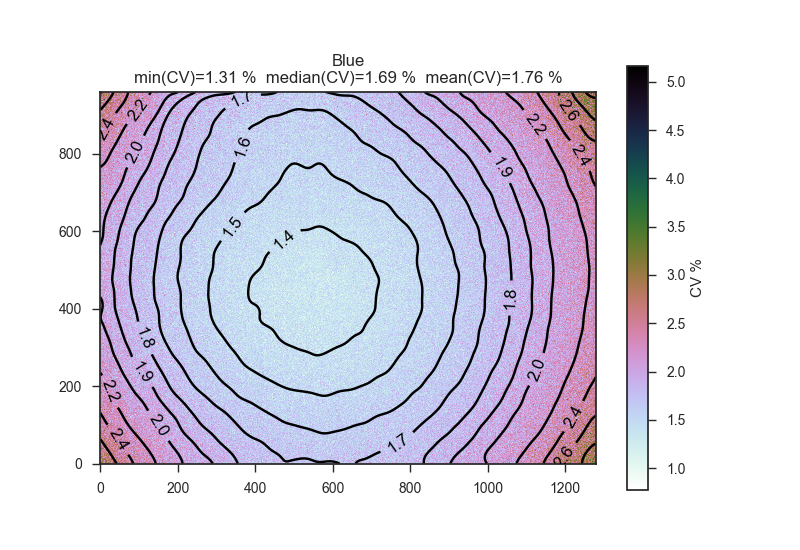
fluorescent coefficient of variation with blue excitation on uranyl glass.
The next step is to test the system using fluorescent beads of known diameter, where the CV will be worse as a figure of merit vs. other systems.